Looking Forward : How to Monitor Progress towards Infrastructure Resilience
A.1. Towards an Operational Concept of Resilient Infrastructure
All new investments need to be disaster- and climate-resilient to avoid accumulating new contingent liabilities, increasing asset loss and damage, and service disruption
As discussed in Chapter 1, resilience is a broad concept that can refer to different domains: social and economic, assets, services, sustainability, systemic, and financial or fiscal resilience.
Resilient infrastructure and infrastructure for resilience (GCA, 2021) refer to two different, but interdependent, dimensions of infrastructure resilience. Resilient infrastructure refers to infrastructure that, through appropriate planning, design, construction, operations, and maintenance, can absorb, adapt, and transform to changing conditions and which can, therefore, continue providing essential services to households, communities, and businesses. The asset and service resilience domains described in Chapter 1 are closely associated with resilient infrastructure. They are also supported by infrastructure governance and fiscal resilience. With respect to the latter, asset loss and damage and service disruption have negative fiscal effects, particularly in weak economies. At the same time, fiscal health influences the capacity to strengthen assets, services, and sustainable resilience.
This Annexure proposes a composite indicator, based on the GIRI, that combines the financial risk metrics presented in Chapter 2 with three different sets of social, economic, environmental, and political indicators representing the capacity of infrastructure assets and the services they provide to absorb the impact of hazard events, respond, and restore. As the Index can be disaggregated according to the range of indicators chosen, it can be used to monitor change over time and whether countries are making progress in strengthening their resilient infrastructure.
The GIRI Index is a proof of concept of a methodology to measure the evolution of infrastructure resilience over time. The testing and application of the methodology will allow further review and refinement, such that it can be validated for use as a monitoring tool in future editions of the Biennial Report.
A.2. Indicators or Surveys?
Many initiatives have proposed indicators for measuring resilience, mainly at the local and community levels,  Over 90 methodologies were identified in the report: Community Resilience Indicator Analysis (CRIA) methodologies from 2018 and 2021, most of them at the community and local levels (FEMA, 2022). These methodologies, however, are the ones included for the CRIA methodology and other methodologies at global, national, and regional levels have not been included. including the Critical Infrastructure Resilience Index (CIRI) (Cadete et al., 2018), Technical Resilience Analysis (ITRA), Organizational Resilience Analysis (IORA) (Storesund et al., 2018), the Resilience Measurement Index (RMI)(Petit et al., 2013), the Critical Infrastructure Resilience Evaluation (CIRE)(Bertocchi et al., 2016), the Benchmark Resilience Tool (BRT) (Resilient Organizations, 2023), the Organizational Resilience Health Check (ORHC) (Department of Home Affairs, n.d.), the Resilience Analysis Grid (RAG) (Hollnagel et al., 2011), the OECD Guidelines for Resilience System Analysis (OECD, 2014), the Resilience Management and Matrix Audit Toolkit (The RESILENS Decision Support Platform, n.d.), the Resilience Maturity Model Tool (Hernantes et al., 2016), among many others. Reviews have also been undertaken that highlight their diversity and overlap (Curt and Tacnet, 2018; Derakhshan et al., 2022; Dianat et al., 2022; FEMA, 2022; GCA, 2021; Gillespie-Marthaler et al., 2018; Graveline and Germain, 2022; Pursiainen and Rød, 2016; Zuzak et al., 2022).
The EU SmartResilience project is another initiative that aims to compare and align efforts to measure resilience and promote standardization. The SmartResilience indicators are based on questions that respond to the expected behaviour of infrastructure if adverse events occur, how the operation of one can impact the operation of others, and how to optimize infrastructure investment (Jovanovic et al., 2018).
Indicators represent the simplification of complex systems (Vinchon et al. 2011) and, as such, are only an indicative, indirect representation of reality. Normally, sets of indicators are required to represent different aspects or domains of an issue and to identify which domains contribute more to aggravate or minimize a problem. Also, the use of multiple sub-indicators recognizes that interventions in a single area might not be enough to achieve a broad goal, such as resilient infrastructure.
Surveys can also support the understanding of infrastructure resilience (Chow and Hall, 2023; Jovanovic et al., 2018). If the sample used is statistically significant and the right stakeholders are chosen, they can provide in-depth information, particularly on issues for which quantitative information is not available. Examples of surveys addressing resilience include the Risk Management Index (RMI), which was developed for the InterAmerican Development Bank (IDB) in 2004 (Cardona et al., 2005).
The RMI benchmarks the effectiveness and performance of disaster risk management and has been used by the IDB to support the evaluation and monitoring of programmes in that region. Another IDB survey-based index is the Index of Governance and Public Policy in Disaster Risk Management (iGOPP) (Lacambra and Guerrero, 2017). Risk auditing is another way to assess the effectiveness of disaster risk management, as, over time, it is possible to determine whether the risk is increasing or decreasing by benchmarking the same country.
A survey of infrastructure resilience proposed by the University of Oxford and CDRI is the Global Infrastructure Resilience Survey (GIRS). This survey proposes to capture intangible aspects of infrastructure resilience, particularly qualitative aspects of infrastructure governance and management. Through the analysis of infrastructure management components: policy, accountability and renforcement, financial capacity, institutional stability, disaster response, and maintenance and standards, the GIRS captures and reflects the impediments that specialists and stakeholders may face in the management process. The first edition of GIRS has captured survey data from 686 experts in 87 countries and opens future opportunities for deepening the understanding of infrastructure governance and management beyond top-down infrastructure governance datasets, such as the World Governance Indicators (WGI) (Chow and Hall, 2023).
A.3. Global Frameworks for Monitoring Progress
Three global frameworks were agreed upon in 2015: the 2030 Agenda for Sustainable Development, structured around a set of Sustainable Development Goals (SDGs), the Paris Agreement on Climate Change, and the Sendai Framework for Disaster Risk Reduction (SFDRR) 2015−2030. Each of these frameworks adopted or created sets of targets and indicators to measure progress, which, in principle, could provide a basis for monitoring infrastructure resilience.
Unfortunately, the mid-term reviews of the SDGs and the Sendai Framework show that most of the indicators are not yet available in all countries. The development of the information and data infrastructure needed to fill this gap will require a greater investment of financial and human resources to support statistical development (UN, 2022).
Figure A.1 shows that the number of countries with data to inform the indicators of each SDG is less than 100 across all the SDGs. Less than 60 countries have data to inform indicators of each SDG, except for SGDs 6, 7, 9 and 15. While the SDG indicators include data that could be extremely valuable for measuring and monitoring infrastructure resilience, global comparative coverage is still a future aspiration rather than a present reality

![]() Figure A.1 Proportion of Countries or Areas with Available Data Since 2015, by SDGs Source: UN (2022)
Figure A.1 Proportion of Countries or Areas with Available Data Since 2015, by SDGs Source: UN (2022)
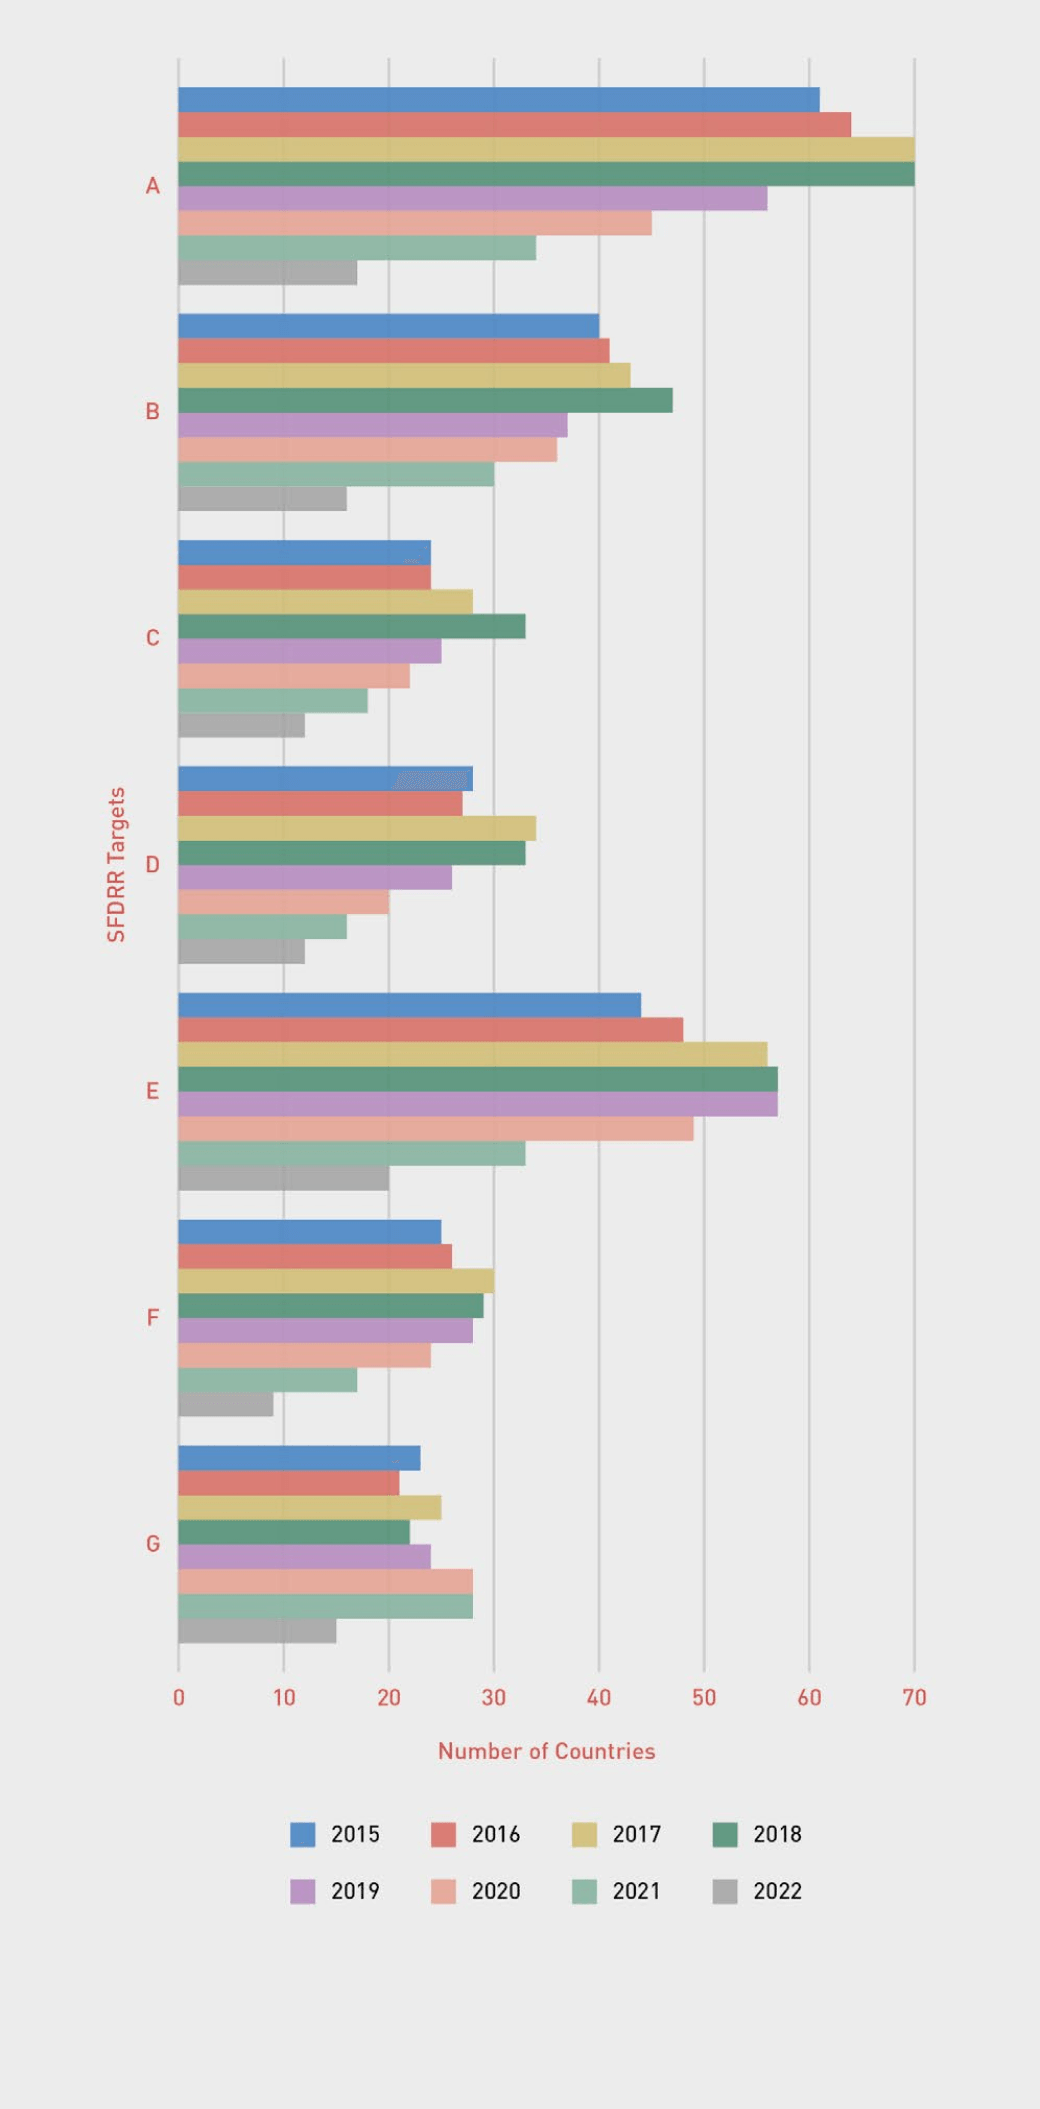
In the case of the Sendai Framework for Action (Figure A.2), the number of countries reporting back across Targets A–G has steadily declined since 2017. In 2021 and 2022, less than 20 countries reported on the indicators chosen to measure Target D (Substantially reduce disaster damage to critical infrastructure and disruption of basic services, among them health and educational facilities, including through developing their resilience by 2030). This is not a statistically significant or useful sample on which the global monitoring of progress towards infrastructure resilience can be based.
Until the coverage of data dramatically improves, the indicators proposed by the SDGs and Sendai Framework are not useful for measuring progress in resilient infrastructure. However, when better data coverage is achieved, they could make an important contribution.
![]() Figure A.2 Evolution of Country Reporting by the SFDRR Target, based on the Sendai Monitor Source: UNDRR (2022)
Figure A.2 Evolution of Country Reporting by the SFDRR Target, based on the Sendai Monitor Source: UNDRR (2022)
A.4. The GIRI Resilient Infrastructure Composite Indicator
The risk of service disruption and interrupted social and economic development is largely a function of asset loss and damage. As such, while the financial risk metrics presented in Chapter 2 only measure the contingent liabilities associated with infrastructure assets, they do capture an important part of the resilience challenge.
This challenge can be understood in terms of the capacity of a country to design, build, and manage infrastructure assets in a way that reduces vulnerability and exposure to hazard events and to have systems in place that enable rapid response to asset loss and effective recovery of damaged assets and interrupted services after an event. Measuring this capacity can make resilience a more tangible and visible concept and may provide additional incentives for governments to invest in resilience and capture the associated dividend.
Even if the focus is limited to asset resilience, there is no single intervention that can make infrastructure resilient but a coordinated set of actions. A range of social, economic, political, environmental, and other considerations influence a country’s capacity to invest in resilience. If countries are to set resilience goals and targets in the context of national resilience policies, strategies, and plans, indicators are required to measure their progress in terms of achievement of the targets.
The proposed GIRI composite indicator The GIRI was calculated for 171 countries that have indicators available for the capacities considered in the composite indicators. Countries that have not been included in the GIRI did not have enough indicators available. integrates the financial risk metrics discussed in Chapter 2 with three different sets of indicators that represent the capacity to resist and absorb, respond, and restore or recover from hazard events. Additionally, the GIRI incorporates an estimated infrastructure gap The infrastructure gap is expressed as a percentage of GDP. The data has been sourced from the Global Infrastructure Hub, Asian Development Bank, and Infralatam. Due to significant variations in the information and the absence of data for certain countries, averages for geographic and income regions were calculated to assign values to countries with missing information. For African countries, the African Infrastructure Development Index provided by the African Development Bank was used to adjust the derived factor from the average. that accounts for the difference between the infrastructure required to meet the SDGs and the existing infrastructure.
The Index offers an operational picture of resilience based on multi-hazard physical risk in infrastructure systems, conditioned by the infrastructure
gap and further impacted by various social, economic, and environmental factors. Within this holistic framework, vulnerability is considered from a physical perspective (the susceptibility of exposed elements or assets to damage) and contextual perspective, encompassing a range of additional attributes or variables.
The composite indicator maps the global landscape of resilient infrastructure with a national level of resolution. Nevertheless, the same ‘arithmetic’ can be applied by countries at higher resolutions at the sub-national and local levels.
The composite indicator illustrates how probabilistic risk metrics and social, economic, and other variables can be integrated into a methodology that identifies the levels of change available to countries to strengthen infrastructure resilience.
A.5. Methodology and Indicators
The GIRI composite indicator has relative values between 0 and 100. The lowest value (0) indicates that infrastructure has low resilience, and the highest value (100) means resilience is high. Figure A.3 shows how the GIRI composite indicator can be disaggregated into the three capacities, each of which, in turn, can be disaggregated into component indicators.
The capacity to absorb is represented as a sudden loss in the performance or capacity of infrastructure assets to provide essential services due to loss and damage associated with hazard events. It is conditioned by physical risk and social and economic variables, which may aggravate the potential impact of the hazard events, leading to larger losses in performance (Cardona, 2001; Birkmann et al., 2013; Bruneau etal., 2003; Burton et al., 2014; Carreño et al., 2007).
The capacity to respond is represented as a horizontal line, whose length represents the ability to respond fast and efficiently. The shorter the line, the higher the capacity to respond following the event as a first phase of recovery. The recovery stage is assumed to start after the response phase and continues until the assets have been restored and services recovered. The inclination of the slope represents a strong (80°) or weak (10°) capacity to recover quickly and efficiently.
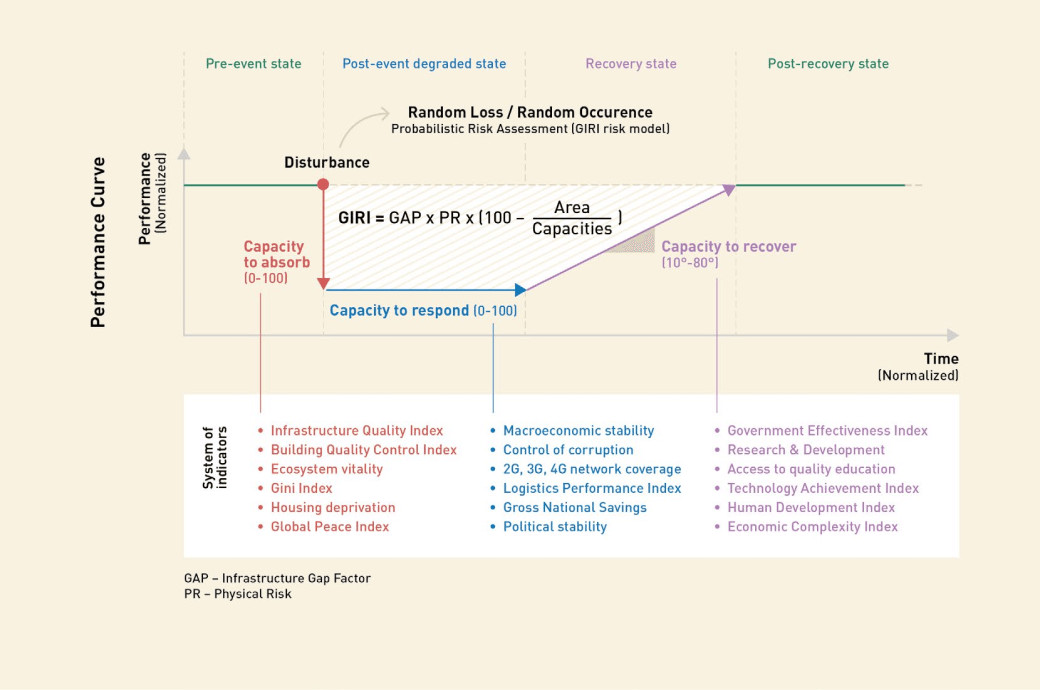
![]() Figure A.3 Conceptual Framework of GIRI Source: Cardona et al. (2023b)
Figure A.3 Conceptual Framework of GIRI Source: Cardona et al. (2023b)
Figure A.4 shows the relationship between a set of qualities that would characterize resilient infrastructure, the three capacities described above, and the suite of indicators chosen to measure the capacities. Some indicators can be associated with all the three capacities but have been assigned to
the capacity with which they seem more closely related.
For example, the quality of infrastructure indicator was assigned to the capacity to absorb because, in the case of better-quality infrastructure built to high standards, the drop in performance is likely to be less than in lower-quality infrastructure. Similarly, countries with significant investments in innovation and technology are likely to experience faster and more efficient recovery compared to countries with lower levels of investment in innovation and technology.
Six indicators were chosen for each capacity, based on their relevance and the availability of publicly accessible, reliable global data in as many countries as possible. Many other indicators were considered but not chosen because they did not meet these criteria.
The indicators that compose each capacity are normalized to allow their aggregation. All indicators were assigned the same weight. For instance, the indicators for the capacity to absorb and for the capacity to respond range from 0 to 100, where the higher values mean a slight drop in performance
and rapid and efficient response, respectively, and lower values mean a high drop and poor and inefficient response, respectively. Inverted scaling was used to provide appropriate measurement.
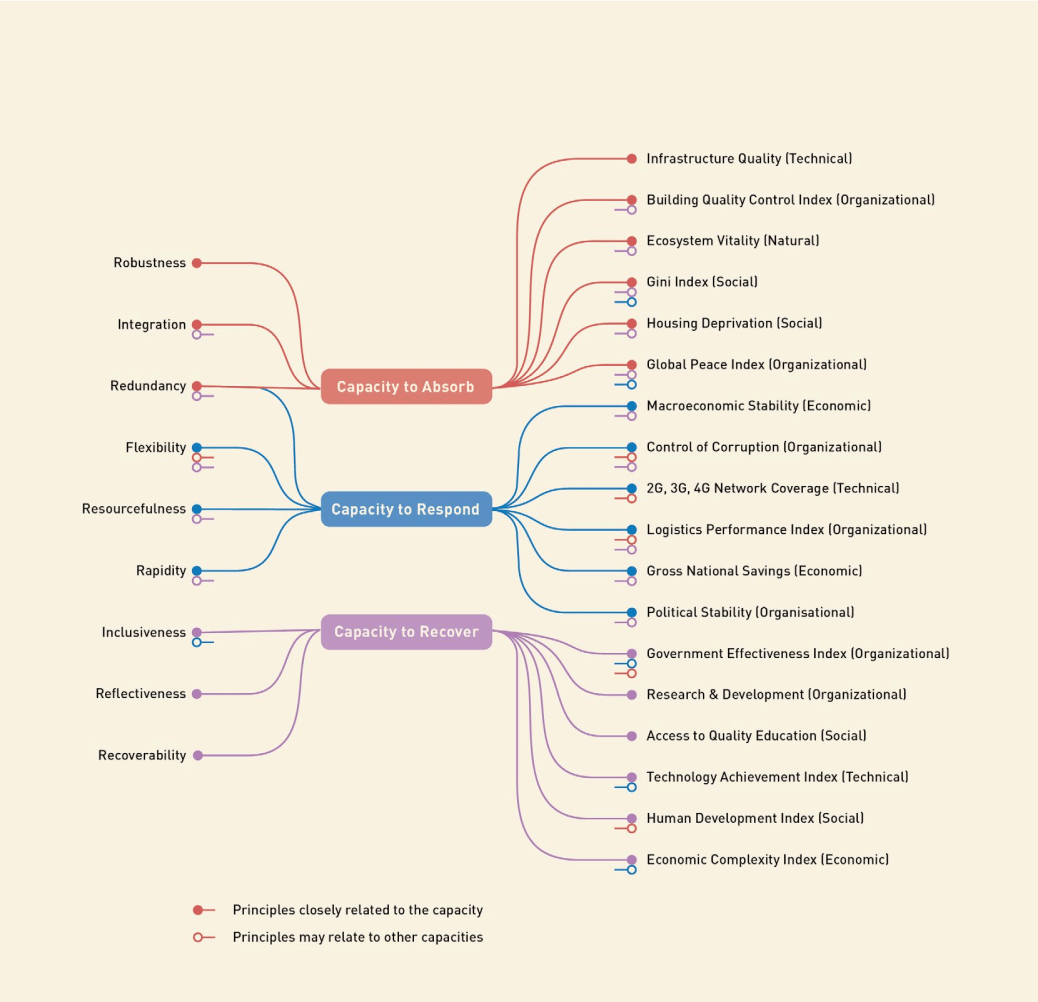
![]() Figure A.4 Interconnectedness between the Qualities of Resilient Systems and the Three Resilience Capacities and between Indicators
Figure A.4 Interconnectedness between the Qualities of Resilient Systems and the Three Resilience Capacities and between Indicators
Source: Cardona et al. (2023b)
A.5.1. Capacity to Absorb
The average annual loss (AAL) from the GIRI model presented in Chapter 2 is the base input for the GIRI composite indicator. The AAL is a robust metric that condenses in a single number the overall level of disaster and climate risk, internalized in a country’s infrastructure.
The AAL provides insight into potential loss and damage to infrastructure assets. It, thus, provides a first window to examine the capacity to absorb hazard events of different intensity and frequency. However, while the AAL captures the physical resistance and robustness of an asset, the relative AAL can result in low values due to various factors. These factors include the absence of significant hazards in the country, low vulnerability of the exposed assets, or even the absence of assets themselves. To account for these situations, a factor is applied to the relative AAL, addressing the lack of infrastructure and, indirectly, obsolescence and the lack of redundancy.
The physical risk is, then, aggravated by combining six contextual indicators that condition it:
 Infrastructure quality (FM Global Resilience Index, 2022): Good quality infrastructure will be reflected in a better performance of the assets when a hazard event occurs.
The building quality control index (World Bank, 2002): This includes variables such as the quality of regulation; of control before, during, and after construction; professional liability and insurance regulation; and certification. Good building quality should indicate better building practices inherent in infrastructure with higher resistance to hazard events.
Ecosystem vitality (Yale Center for Environmental Law and Policy and Center for International Earth Science Information Network Earth Institute, 2022): Healthy ecosystems can lead to more sustainable growth of assets and income, economic development, and well-being of people. As Chapter 3 highlighted, ecosystem preservation and restoration can contribute to resilience to climate change and climate change mitigation. In turn, environmental degradation is a major driver of disaster risk. The low quality and quantity of ecosystem services exacerbate climate change.
Gini Index (World Bank, 2023): This index represents income, wealth, or consumption inequality within a nation or social group. More unequal countries are less likely to dedicate resources to strengthen the resilience of infrastructure meant to service disadvantaged social groups. More equal societies are also more resilient. Flatter hierarchies lead to higher cooperation among individuals (Germano and Demetrius, 2014).
Housing deprivation (University of Oxford, n.d.): This reflects social and economic inequality and the capacity of governments to deliver safe and affordable housing (SDG11). High rates of housing deprivation are likely to be reflected in significant parts of the population living in unplanned and unregulated settlements with precarious infrastructure that has a low capacity to resist hazard events.
The Global Peace Index (Vision of Humanity, n.d.): This index considers international and domestic conflict, social safety and security, and militarization. A positive value may indicate outcomes such as higher per capita growth, better environmental performance, less civil conflict, or violent political shocks, as well as infrastructure with higher resistance.
A.5.2. Capacity to Respond
The following six indicators represent a country’s capacity to respond to disasters as well as how well it performs in terms of disaster response.
 Macroeconomic stability (The Legatum Institute Foundation, 2021): It measures how robust an economy is. A strong economy means that a government will have more resources available for an effective and timely response without having to increase indebtedness.
Control of corruption (Kaufmann and Kraay, 2022): Corruption may erode the financial resources available to respond to infrastructure failures and undermine capacities for service restoration.
2G, 3G, and 4G network coverage (Groupe Speciale Mobile Association, n.d.): Access to wireless communication directly influences effective and timely disaster response. Better network coverage can allow authorities to access real-time information on the distribution of asset loss and damage and service disruption, and can facilitate communication between affected households, communities, businesses, and the different stakeholders involved in the response, including utility providers, emergency services, and others.
Logistics and Performance Index (LPI) (World Bank, 2023): Emergency response requires proper, structured, standardized, and organized logistics to respond efficiently and fast. Ineffective logistics can result in underperformance in emergency response and an inability to handle an event fast and efficiently. The LPI consists of both qualitative and quantitative measures that provide an understanding of how well countries do in terms of logistics processes, logistics environment and institutions, and constraints hindering the smooth flow of logistics activities present at ports, borders, or inside the country. It, therefore, measures performance along the whole logistics supply chain within a country. LPI is considered a vital element in the economy’s competitiveness (Arvis et al., 2007).
Gross National Savings (World Bank, 2023): The national savings rate measures the amount of income that households, businesses, and governments save. It looks at the difference between the nation’s income and consumption and is a gauge of a nation’s financial health, as investments are generated through savings. Gross national savings can serve as access to resources in the case of emergencies or as a backup to borrow economic resources to respond to emergencies.
Political stability (Kaufmann and Kraay, 2022): Political stability and absence of violence measure perceptions of the likelihood that the government will be destabilized or overthrown by unconstitutional or violent means, including politically motivated violence and terrorism. Political instability and violence may undermine response efforts due to the difficulty in accessing resources and the lack of strong institutions that avoid rapid and efficient interventions.
A.5.3. Capacity to Recover
The capacity to recover reflects how well a country can recover from asset damage and service disruption. The better the performance, the steeper the line. This is more closely related to the depth of the drop in the capacity to absorb than to the length of the response line. The six indicators chosen for the capacity to restore infrastructure and strengthen future resilience are as follows:
 Government Effectiveness Index (Kaufmann and Kraay, 2022): It captures perceptions of the quality of public services, the quality of the civil service and the degree of its independence from political pressures, the quality of policy formulation and implementation, and the credibility of the government’s commitment to such policies. This index reflects the capacity of a government to plan and manage a robust recovery of infrastructure assets and essential services.
Research and Development (WIPO, 2022): According to the OECD, research and development intensity is one of the several indicators used to measure progress towards achieving SDG 9. SDG 9 seeks to build resilient infrastructure, promote inclusive and sustainable industrialization, and foster innovation.
Access to Quality Education (The Legatum Centre for National Prosperity, 2023): Access to quality education leads to a country with higher productivity and, therefore, a stronger economy. Access to quality education ensures the presence of highly qualified professionals who will work towards a robust and quick recovery of infrastructure and services.
Technology Achievement Index (Desai et al., 2002): It reflects the country’s technological capacity, including associated human resources. Access to new or enhanced technologies will normally speed up recovery, including the opportunity to use the recovery process to introduce innovations.
Human Development Index (UNDP, 2021b): The Human Development Index (HDI) is a composite index of life expectancy, education, and per capita income indicators. It is directly relevant to local and community vulnerability, which, in turn, influences the recovery process (Raikes et al., 2021; Hallegatte et al., 2020; UNDP, 2020; Lewis, 2012; UNDP, 2004). A high HDI indicates countries with better levels of education and hence, skills and scientific knowledge, better health systems that provide a basis for sustainable recovery, and higher income levels that reflect the availability of savings, access to credits, insurance, etc., that are critical to effective recovery
Economic Complexity Index (Observatory of Economic Complexity, n.d.): It reflects the overall state of a country’s economy and, therefore, its capacity to successfully recover from hazard events. The resilience of today’s infrastructure is the result of decisions and actions of the past. However, resilience can be enhanced if the underlying factors that condition its capacity to absorb, respond, and restore are modified. That is why it is important to treat resilience as an attribute of performance rather than as the state of a system. The former creates incentives for action, while the latter may lead to inertia and inaction.
Therefore, the GIRI composite indicator can be used to monitor how capacities change over time, which in turn can be disaggregated by the indicators that compose each capacity. Understanding resilience as a performance characteristic improves understanding of the dynamics of change in each country.
A.6. The GIRI Assessment
The GIRI is presented in two formats: as a single numerical value and as a curve. The numerical value represents the ratio of the area of the trapezoid formed by the three capacities to the sum of those capacities, as shown in Figure A.3. This quantitative representation enables the ranking of countries based on their resilience. However, depicting the shape of the curve provides a more comprehensive understanding of resilience. It also offers a clearer illustration of how physical risk and the infrastructure gap influence the value and shape of the GIRI curve.
A.6.1. Infrastructure Gap
The infrastructure gap (Cardona, 2001; Carreño et al., 2007) is defined as the difference between the existing infrastructure and the infrastructure needs. The gap reflects implications that are not necessarily reflected in the risk metrics as shown in the following examples:
Lack of capacity: The lack of capacity of infrastructure assets to provide services and support social and economic development creates system vulnerability and magnifies the effects of hazard impacts
Infrastructure obsolescence: Outdated or obsolete infrastructure A.6. The GIRI Assessment that has outlived its design life is more prone to failures and collapses. Insufficient investment in infrastructure maintenance, modernisation, and upgrading increases its fragility and reduces its resilience against threats and adverse events
Limited diversification and redundancy: A large infrastructure gap challenges system redundancy, increasing dependence on single infrastructure assets and increasing service vulnerability
Longer recovery time: A large infrastructure gap may increase the recovery time after an adverse event, reflecting a lack of resources and capabilities for recovery
The infrastructure gap factor was used to condition the risk metrics in the GIRI resilience index. The infrastructure gap is basically the difference between the actual investment and the investment required to fill the gap, expressed as a percentage of gross domestic product (GDP). This is then used to modify the AAL. Due to significant variations in the information available in some countries, averages were calculated by geographic and income regions to assign values to those countries with missing information. 5 For African countries, the African Infrastructure Development Index provided by the African Development Bank was used to adjust the derived factor from the average.
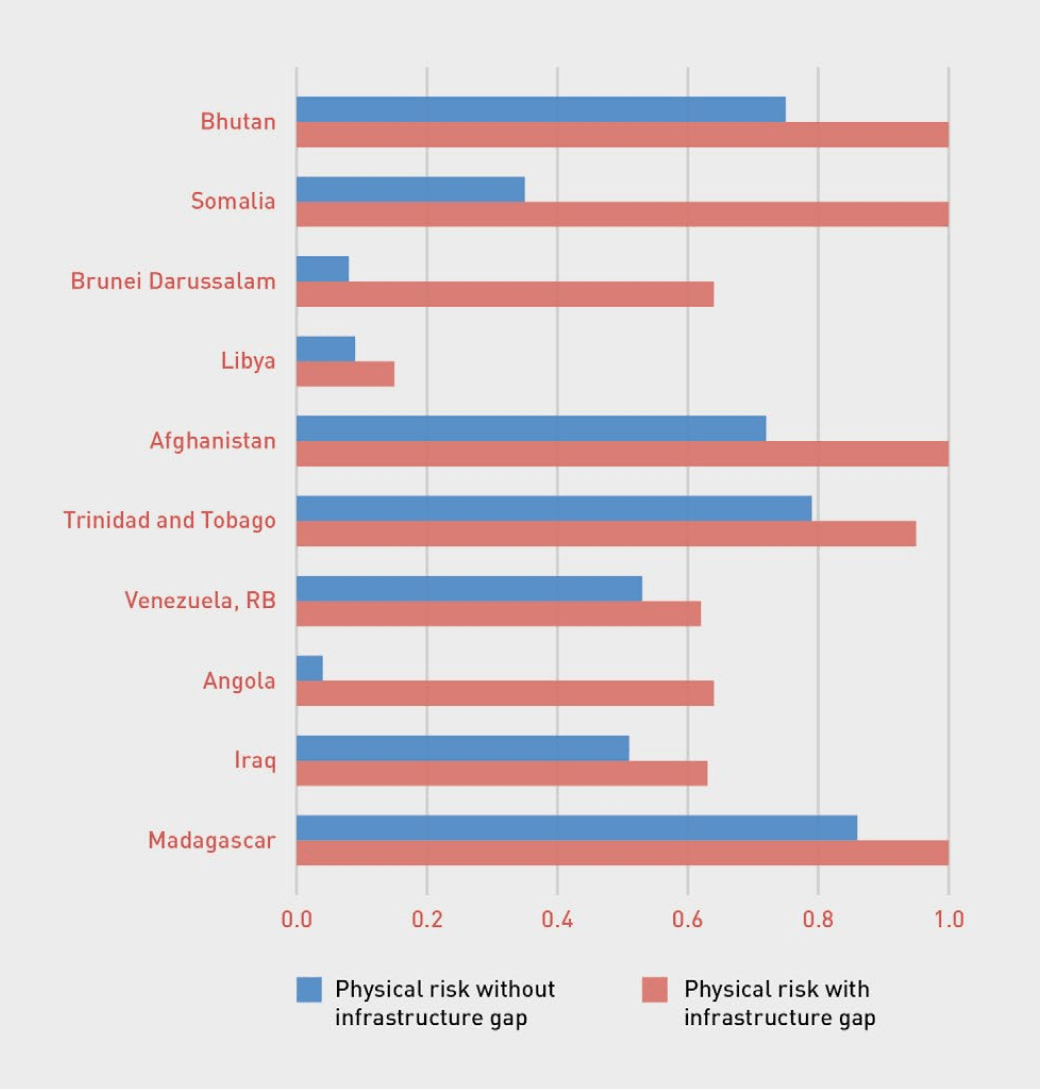
![]() Figure A.5 Influence of Infrastructure Gap on Physical Risk
Figure A.5 Influence of Infrastructure Gap on Physical Risk
Countries with a very low infrastructure density may appear to have very low risk. However, this often reflects a very low exposed value rather than high levels of physical resilience. Without taking the gap into account, hazard-prone countries with a low infrastructure density may appear to have high levels of resilience. Conditioning the risk by the infrastructure gap factor corrects this.
Figure A.5 highlights how the risk metrics change after processing, considering the gap factor. Countries with a greater infrastructure density exhibit less significant changes in their physical risk values than countries with a considerable infrastructure gap.
A.6.2. Inherent Resilience
Given that the GIRI is an index of resilience to disaster- and climate related risk, using the AAL as the base of the index is crucial. To demonstrate the influence of the physical risk on the GIRI, inherent resilient curves were constructed for each country. They consist of varying the value of physical risk, from zero to one, by maintaining all the other values that compose the GIRI. By following this procedure, it is possible to obtain points of GIRI values for each assigned physical value. The curve is then the union of all the points for a country. The blue points in Figure A.6 correspond to the GIRI values obtained with the level of physical risk the country currently faces, according to the risk model.
As Figure A.6 shows, countries with strong capacities to absorb, respond to, and recover from asset loss and damage have a flatter curve. This indicates a lower variation in resilience, even when there is a high degree of variation in risk. Conversely, countries with weaker capacities have a high variation in resilience, particularly in the case of significant fluctuations in physical risk. When a country faces low physical risk, the GIRI tends to have higher values, whereas higher physical risk levels result in lower GIRI values. How steep or flat the curve is depends on each country’s capacity to absorb, respond, and recover. For instance, Japan exhibits stronger capacities than the United States of America, Honduras, Algeria, and Burkina Faso.
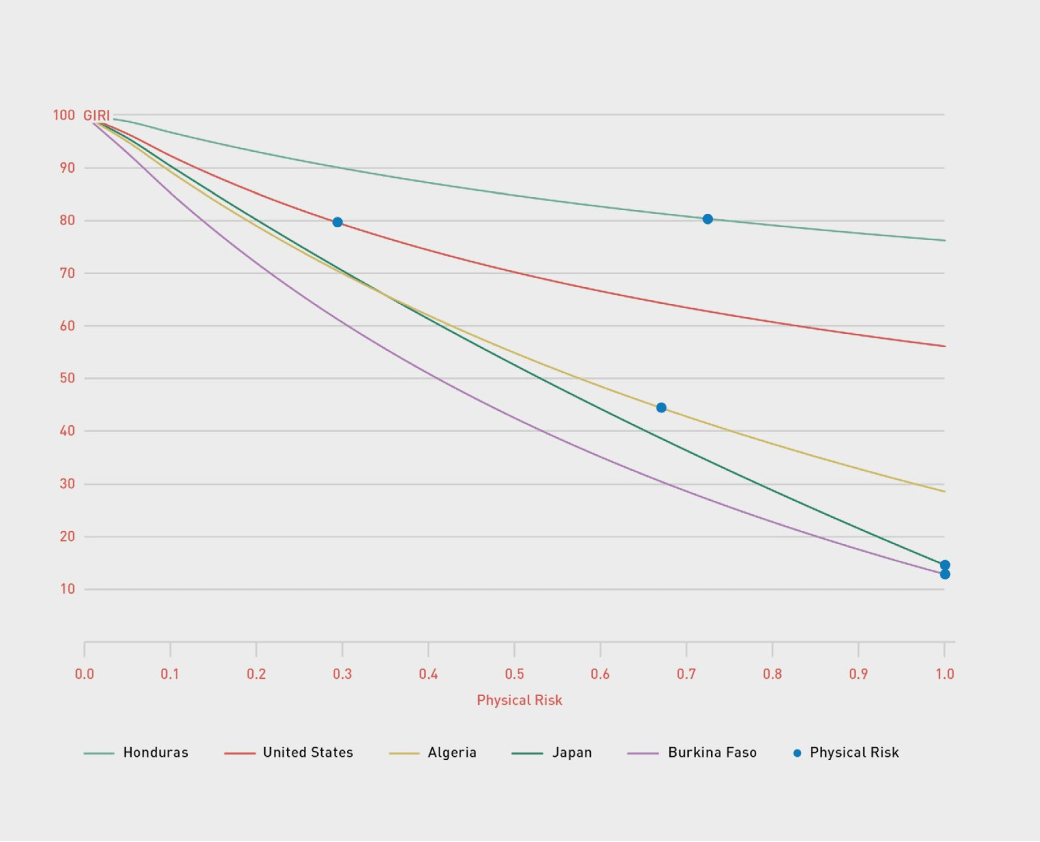
![]() Figure A.6 Representation of Inherent or Endogenous Resilience for Honduras, the United States, Burkina Faso, Algeria, and Japan Source: Cardona et al. (2023b)
Figure A.6 Representation of Inherent or Endogenous Resilience for Honduras, the United States, Burkina Faso, Algeria, and Japan Source: Cardona et al. (2023b)
The rate of change of the inherent resilience curves results in a representative resilience curve due to the similarity with the performance and time attributes that represents a country’s performance in the face of a potential disaster. Although the values resulting from the derivative of inherent resilience do not hold representative significance, the curves offer valuable insights into the speed at which a country can restore its infrastructure and services. For instance, in Figure A.7, Japan demonstrates a relatively shorter decline and achieves a faster recovery compared to the other countries presented. Although Honduras experiences a shorter decline than Burkina Faso and Algeria, their capacities enable a more favourable recovery than Honduras.
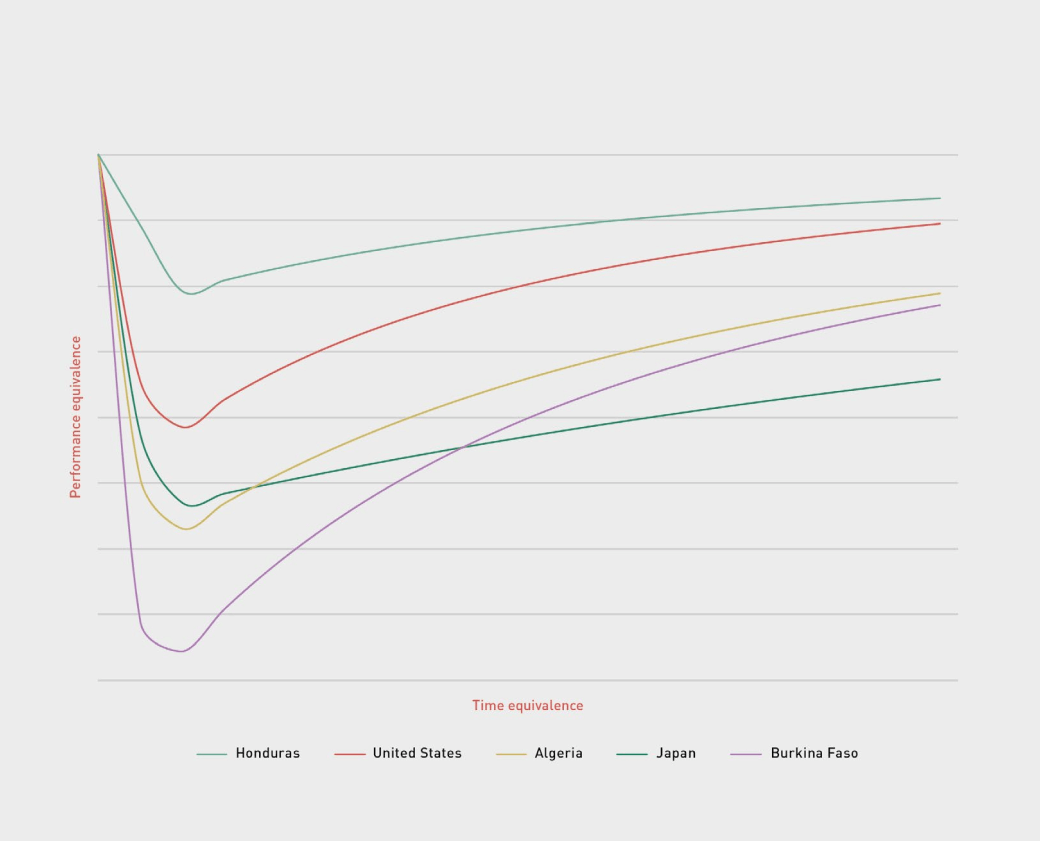
![]() Figure A.7 Representative Resilience Curves Reflecting the Rate of Change of the Inherent Resilience Curves for Honduras, the United States of
Figure A.7 Representative Resilience Curves Reflecting the Rate of Change of the Inherent Resilience Curves for Honduras, the United States of
America, Burkina Faso, Algeria, and Japan Source: Cardona et al. (2023b)
A.7. Global Infrastructure Risk Model and Resilience Index (GIRI)
The primary objective of the GIRI is to assess and rank countries based on their resilience levels, thereby identifying areas that require focused efforts. The GIRI also enables the measurement of progress over time in enhancing resilience. For instance, countries may have similar GIRI values, but their resilience curves can differ, as shown in Figure A.7. One country may exhibit shortcomings in its capacity to absorb but possess stronger capacities to respond and recover. While the area under the resilience curve and thus the overall GIRI value may be similar, each country has a different range of capacities.
The resilience of today’s infrastructure is the outcome of past decisions and actions. However, resilience can be enhanced through appropriate investments in improving infrastructure robustness, flexibility, redundancy, and overall quality, including enhanced design standards and increased investment in operations and maintenance. Modifying the underlying factors that reflect the capacities to absorb, respond, and recover can strengthen resilience.
The GIRI composite indicator can be utilized to monitor changes in vulnerability and capacities over time, and it can be disaggregated into risk indicators and individual capability indicators. Viewing resilience as a performance characteristic enhances our understanding of the dynamics of change within each country. A similar approach can be implemented at the sub-national level to track infrastructure resilience using a localized GIRI, which incorporates indicators and surveys to directly capture and measure risk and the capabilities of isolated and systemic infrastructures.
A.8. Towards a Methodology for Measuring Infrastructure for Resilience
As described above, the GIRI composite indicator has been designed to monitor progress in resilient infrastructure. However, many of the indicators can be reconfigured to measure infrastructure for resilience, in other words whether infrastructure is contributing to social and economic development, systemic resilience, and fiscal health (GCA, 2021), and how a country is performing in different areas or domains [Technical, Organisational, Social, Economic and Ecological or Ecosystemic -TOSEE] (Bruneau et al., 2003).
The disaggregation of the GIRI composite indicator to its component indicators allows the exploration of aspects that can support the measurement of performance in infrastructure for resilience in TOSEE domains. For example, indicators on contextual conditions, such as ecosystem vitality or the building quality control index, could be useful for measuring whether new infrastructure investment is contributing to increased (GCA, 2021; UNDRR, 2022) systemic risk, while others, such as housing deprivation, Gini and HDI, can measure whether infrastructure investment is contributing to sustainable and equitable social and economic development.
Chapter 1
The Resilience Challenge


Chapter 2
The Global Landscape of Infrastructure Risk
Chapter 3
Strengthening Systemic Resilience: Upscaling Nature-based Infrastructure Solutions (NbIS)
Chapter 4
Financing for Disaster- and Climate-Resilient Infrastructure
Chapter 5
Capturing the Resilience Challenge
Annexure I